Introduction
Techniques for generating synthetic tabular data have evolved over the last few years, primarily in support of data collaboration initiatives to bypass privacy barriers. Although data sharing is a compelling use case, tabular data generation has far broader and business-critical applicability such as dramatically improving ML model prediction accuracy by closing the gaps related to availability of high-quality data. When generated properly, the synthetic data can be used to augment small datasets, balance data with more instances from the minority class, or complete missing values. In this document, we demonstrate the superiority of the Datomize generative model by comparing its performance with leading open-source generative models and synthetization techniques.
There are several available open-source techniques for generating synthetic tabular data. Statistical models for tabular data generation rely on predefining the probability distribution of the table. The GaussianCopula model is based on copula functions[1], that allow describing the joint distribution of multiple random variables by analyzing the dependencies between their marginal distributions. Different GAN models have been created for generating synthetic tabular data; among the popular ones are CTGAN[2] and CopulaGAN[3], as well as VAE-based models like TVAE[4]. Commercial methods like Gretel.ai[5] use deep generative architectures as well.
The Datomize generative model, is based on a VAE that reduces the input into latent space where a GAN model is trained. In cases where text fields are involved, a transformer is incorporated as well. For time-series and transactional data, a special architecture was designed which includes an additional sequential model.
To demonstrate the superiority of Datomize’s generative model, we ran a set of experiments and compared its performance to five (5) additional state of the art, open-source generative models (see Table 1).

Experimental setup
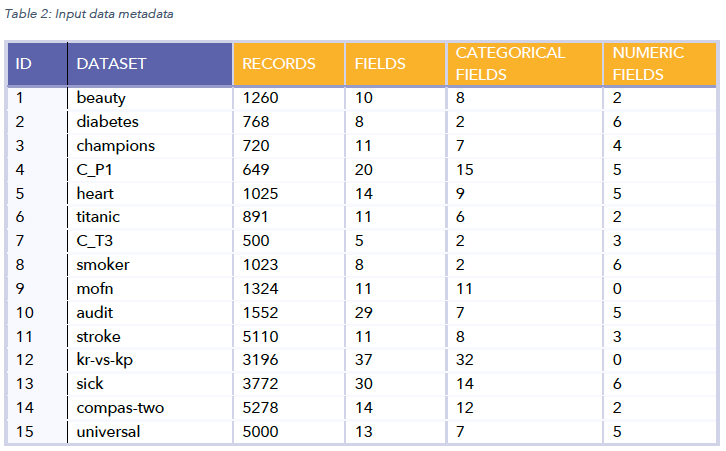
The following 15 datasets (Table 2) were used for our examination:
We compared the Datomize model with five (5) generative models: the Gretel.AI model. GaussianCopula, CTGAN, CopulaGAN, and TVAE. We used SVD’s implementation for the last four methods.
For each input dataset (described in Table 2), using each examined technique, we first trained a model and generated a synthetic replica using it, and then calculated the similarity between the synthetic replica and the source data based on several evaluation measures as discussed in the following section.
Evaluation
We used three different similarity scores to evaluate the similarity between two given datasets (a source and its synthetic replica). Two popular open-source Python implementations (Table Evaluator and SVD Evaluator), as well as Datomize’s rich similarity score.
Table Evaluator
The table evaluator score is calculated as the average of the following measures:
- Basic statistics similarity: Calculates the correlation coefficient between the basic properties (mean, median, standard deviation, and variance) of the source and synthetic datasets using Spearman’s Rho (which is resilient to outliers).
- Correlations: Based on a column-wise correlation calculation between the two data versions. Based on Pearson correlation for numeric columns and Cramer’s V / Theil’s U for categorical columns.
- Column correlations: Calculates the distance between source and synthetic conditional entropy among correlation matrices, with one of those distance metrics [”euclidean”, “mae”, “rmse”].
- MAPE between estimator results: Based on F1 scores for trained classification models for a given list of targets (based on source vs. synthetic training data). The following classifiers are used: Logistic regression, Random Forest, Decision Tree, MLP.
- MAPE 5 PCA components: Calculates the relation between PCA explained variance values. Due to some very large numbers, in recent implementation, the MAPE(log) is used instead of regressions like Pearson’s.
SVD Evaluator
Applies a collection of pre-configured metrics and returns the average of the scores that the data obtained on each one of them, after normalizing them to the 0-1 range.
- Distributions: Statistical tests are executed on all the compatible columns (so, categorical or boolean columns distributions are compared with Chi-Squared test and numerical columns distributions are compared with two-sample Kolmogorov–Smirnov test), and the average score obtained is reported.
- Likelihood Metrics: These metrics attempt to fit a probabilistic model to the real data and later on evaluate the likelihood of the synthetic data on it. The metrics of this family (BayesianNetwork or multiple GaussianMixture models) compare the tables by fitting the real data to a probabilistic model and afterward compute the likelihood of the synthetic data belonging to the learned distribution.
- Detection Metrics: These metrics evaluate how hard it is to distinguish the synthetic data from the real data by using a Machine Learning model (LogisticDetection or SVC). To do this, the metrics will shuffle the real data and synthetic data together with flags indicating whether the data is real or synthetic, and then cross-validate a Machine Learning model that tries to predict this flag. The output of the metrics will be 1 minus the average ROC AUC score across all the cross-validation splits.
- Machine Learning Efficacy Metrics: These metrics train a Machine Learning model on the synthetic data and later on evaluate the model performance on the real data. Since these metrics need to evaluate the performance of a Machine Learning model on the dataset, they work only on datasets that represent a Machine Learning problem. The supported ML models are:
- Binary Classification Metrics:
- BinaryDecisionTreeClassifier
- BinaryAdaBoostClassifier
- BinaryLogisticRegression
- BinaryMLPClassifier
- Multiclass Classification Metrics:
- MulticlassDecisionTreeClassifier
- MulticlassMLPClassifier
- Regression Metrics:
- LinearRegression
- MLPRegressor
- Binary Classification Metrics:
- Privacy Metrics: These metrics fit an adversarial attacker model on the synthetic data and then evaluate its accuracy (or probability of making the correct attack) on the real data. It relies on two additional inputs, sensitive_fields which is a list of columns considered private, and key_fields which are the columns that will be used to try to predict the sensitive ones.
Datomize Evaluator
Datomize’s source compatibility score is calculated as the average of the following measures (each was normalized to the 0-1 range):
- Distributions: Statistical tests are executed on all the compatible columns (so, categorical or boolean columns distributions are compared with Chi-Squared test and numerical columns distributions are compared with two-sample Kolmogorov–Smirnov test), and the average P-value score obtained are reported; the higher the score, the more we are convinced the real and synthetic fields come from the same distribution.
- Correlations: Calculates the average similarity in correlations/strength-of-associations for pairs of fields using:
- Pearson’s R for continuous-continuous cases
- Correlation Ratio for categorical-continuous cases
- Cramer’s V or Theil’s U for categorical-categorical cases
- Utility: Comparing ML tasks results based on real and synthetic data. The evaluation is made on real data while the compared models are trained on real and synthetic data. For each possible target field, we train ML model:
- If the target is a categorical field, the relative F1 difference is calculated and averaged based on the following classifiers:
- Logistic Regression
- Random Forest
- Decision Tree
- If the target is a numeric field, the MAPE is calculated and averaged based on the following regressors:
- Random Forest
- Lasso
- Ridge
- Elastic Net
- If the target is a categorical field, the relative F1 difference is calculated and averaged based on the following classifiers:
- Detection: Calculated by shuffling the real data and synthetic data together with flags indicating whether the data is real or synthetic, and then training 3 classifiers (Logistic Regression, Random Forest, and Decision Tree) that try to predict this flag. The output of the metrics for each classifier is (1-AUC)/0.5.
- Coverage: Calculating the reduction in the cardinality of each field (the synthetic cardinality is divided by source cardinality). For numeric fields, we initially apply discretization into a fixed set of bins.
- Text: The similarity between text fields in the source and the generated data. Calculated as a weighted mean of 2-gram and 3-gram recall; The recall for 2-grams, for example, is the number of source-based 2-grams in the synthetic data divided by the total number of 2-grams in the source data.
- Sequences: The similarity of sequential patterns in the source and generated data, as measured by the similarity in MAPE results of two-time series based prediction models; A model trained on the source data and a model trained on the generated data.
Results
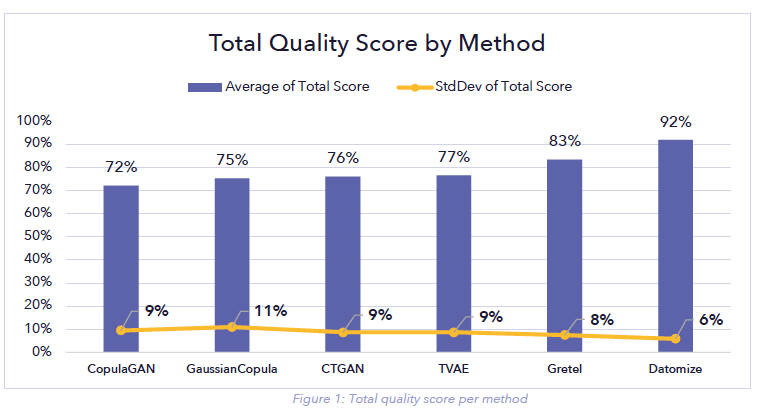
We evaluated the performance of the 6 compared methods, based on 15 datasets and 3 evaluation scores, that measure the quality of the generated data. We also calculated a total quality score equal to the average of the three (3) evaluation scores.
The results can be seen in Figure 1. The Datomize generative model outperforms the nearest method by 9% according to the total quality score.
The details of all three evaluation methods are shown in Figure 2. Datomize’s method significantly outperforms according to each of the three quality scores.
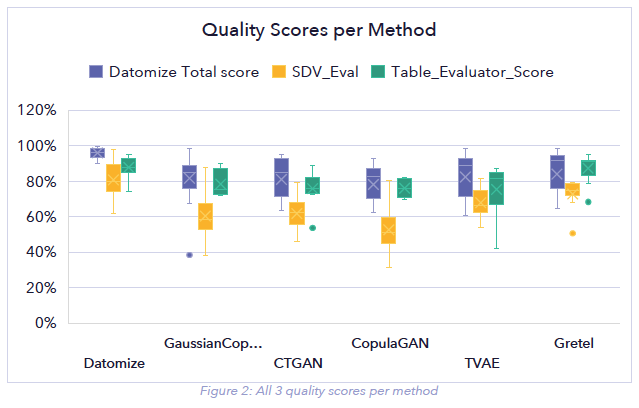
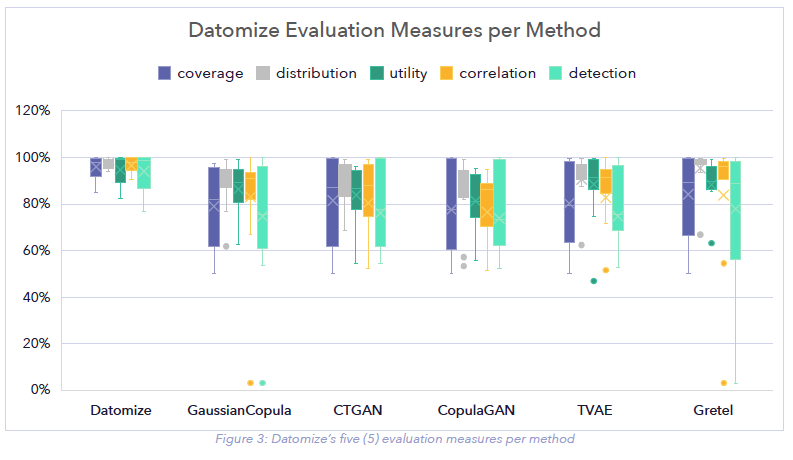
Figure 3 shows the Datomize Score in more detail as it describes each of the similarity scores that compose Datomize total score. We can see that the Datomize method leads in each of the five measured aspects, and that the most significant increase in score is obtained for the detection and the coverage scores.
Conclusions and Future Work
We conducted experiments on fifteen (15) different datasets, comparing the Datomize generative model with five (5) state of the art generative models, aided by three (3) different scores to assess the quality of the generated data. Datomize’s generative model significantly outperforms the five (5) compared methods with an average of 9% increase in total quality score relative to the nearest method.
We are currently working on expanding this benchmark to ~100 datasets, including bigger datasets with up to 1.5M records.
References
[1] Masarotto, G., & Varin, C. (2012). Gaussian copula marginal regression. Electronic Journal of Statistics, 6, 1517-1549.
[2] Xu, L., Skoularidou, M., Cuesta-Infante, A., & Veeramachaneni, K. (2019). Modeling tabular data using conditional gan. Advances in Neural Information Processing Systems, 32.
[3] Neha Patki, Roy Wedge, and Kalyan Veeramachaneni. (2016) , The synthetic data vault. Proceedings -3rd IEEE International Conference on Data Science and Advanced Analytics, pages 399–410.
[4] Ishfaq, H., Hoogi, A., & Rubin, D. (2018). TVAE: Deep metric learning approach for variational autoencoder. In Workshop at International Conference on Learning Representations (ICLRW) (Vol. 32).
[5] Noruzman, A. H., Ghani, N. A., & Zulkifli, N. S. A. Gretel. ai: Open-Source Artificial Intelligence Tool To Generate New Synthetic Data.